LLM spend isn’t a side project anymore, it’s a line item your finance team has to explain. If you’re using LiteLLM, you’re running a proxy (gateway) that lets your app talk to many model providers through one OpenAI-style API. That’s useful, but it also means the gateway becomes part of your uptime and your billing story.
So yes, it’s smart to look for LiteLLM Alternatives when the proxy starts adding risk. Teams report slowdowns under real concurrency (the event loop can get saturated), performance drops as logging piles up in Postgres (people hit a wall once logs grow past about a million rows), and the “restart-fixes-it” pattern when memory or connections get messy. On top of that, token and cost accounting issues (cached tokens, streaming usage gaps, TPM quirks) can make chargebacks hard to trust.
This post gives you a quick TLDR, the biggest pain points buyers keep running into, and a clear list of options (including LLMAPI.ai) with who each one fits. If you also want a broader comparison set for routing and gateways, start with https://llmapi.ai/best-openrouter-alternatives-2026-pick-the-right-ai-gateway-for-real-production-work/.
When LiteLLM works, it feels like a universal adapter for LLMs. When it doesn’t, it becomes the adapter that overheats and slows everything plugged into it. Teams usually start shopping for LiteLLM Alternatives when three things collide: latency under real concurrency, costs they can’t confidently allocate, and operational babysitting (restarts, database tuning, and “why is this slow today?” drills).

If you want the shortest path to a better setup, use this as your decision filter:
Everything else below helps you pick based on the failure mode you’re seeing in production.
Most “we’re fine” deployments stay fine until traffic becomes bursty and multi-tenant. Then the weak points show up in ways finance and ops both feel.
1) Concurrency ceilings and “invisible latency” LiteLLM’s Python runtime can hit a wall under high concurrency. The pain is not just average latency, it’s tail latency and queued time that can be hard to spot. Teams report scenarios where internal timings look okay, but users still wait seconds because the event loop is saturated before request handling even starts.
2) Logging becomes a tax, then a choke point A common production trap is synchronous logging on the request path. Once log tables grow large (many teams cite a slowdown after roughly a million rows), every request starts “paying” for database writes and index contention. You end up choosing between observability and speed, which is not a choice a finance leader wants to hear.
3) Restarts as a reliability strategy Some teams see a “gets worse over time” pattern: higher TTFT, single-core CPU spikes, connection pool weirdness, then a restart makes it vanish. That’s not a fix, it’s a ritual. Even when issues get patched, the confidence hit remains, and buyers go shopping.
4) Cost and usage accounting gaps break chargebacks This is the one finance teams care about most. If cached tokens get counted wrong, streaming usage gets missed, or token mapping differs by provider, the dashboard stops matching invoices. That can lead to internal overcharging, undercharging, or budget alarms nobody trusts.
5) Fast release cadence and regression risk When regressions pop up in core gateway paths (routing, streaming, pricing), teams pin versions and stop upgrading. You can see the shape of this problem in recurring bug reports like custom pricing regressions in streaming endpoints and stability issues that required restarts to recover performance, such as performance degradation fixed by restart.
If your gateway’s numbers don’t match the provider bill, you don’t have “spend tracking”, you have a spreadsheet dispute waiting to happen.
Below is a practical shortlist. Each contender wins in at least one important category; LLMAPI.ai is the only one in this list positioned to be broadly better for most teams because it combines routing, cost controls, and operational visibility with a simple integration path.
If your main pain is “the proxy is now part of our financial reporting”, start here. LLMAPI.ai focuses on the parts that hurt at scale: reliable usage analytics, model and provider breakdowns, and controls that help you prevent spend surprises.
Where it tends to be better than LiteLLM:
Practical fit: scaling teams that need one OpenAI-compatible surface area, plus finance-grade reporting and controls.
If the primary symptom is “we add traffic, then p99 explodes”, check compiled gateways first. Bifrost is often positioned as performance-first, especially at high RPS where Python gateways can struggle.
Where it tends to be better than LiteLLM:
A useful overview is Best LiteLLM Alternative for Scaling, which focuses on performance characteristics and rollout friction.
If you’re stuck on SSO, RBAC, audit logs, or policy enforcement, managed control planes reduce the need to build your own governance layer.
Where it tends to be better than LiteLLM:
Practical fit: orgs that want strong controls and don’t want to run yet another stateful gateway stack.
For globally distributed apps, network distance and retries can dominate perceived latency. Cloudflare’s gateway can help by sitting closer to users and handling certain traffic behaviors more cleanly.
Where it tends to be better than LiteLLM:
Practical fit: consumer apps, chat, and edge workloads where geography matters.
If your company runs its own inference, or wants tighter infra control, you’ll care less about “one proxy to rule them all” and more about fleet operations.
Where it tends to be better than LiteLLM:
A broader market view is helpful here: AI gateways competitive landscape guide.
Sometimes you don’t need a heavy gateway first, you need visibility into what your app is already doing. Helicone is often evaluated as an observability layer to understand costs, latency, and prompt behavior.
Where it tends to be better than LiteLLM:
Practical fit: teams early in cost optimization, or teams auditing prompt and model behavior.
If your pain is streaming and app integration (not provider translation), SDK-first solutions can beat a standalone proxy. Vercel’s tooling is designed around modern web app patterns.
Where it tends to be better than LiteLLM:
Practical fit: product teams shipping LLM features in Next.js and caring most about UI latency and developer speed.
If you’re building multi-step agents, tool calling, and retrieval flows, a gateway alone won’t solve it. LangChain is an app-layer choice, but many teams treat it as the “alternative” when what they really needed was orchestration.
Where it tends to be better than LiteLLM:
Practical fit: teams whose core complexity lives in chains, tools, and agent execution.
One quick gut check: if your main “problem” is provider translation, choose a gateway. If your main “problem” is agent behavior, choose orchestration (and keep the gateway simple).
Community chatter around LiteLLM is real, but it’s scattered across release threads, bug reports, and “does anyone else see this?” posts. Some of the clearest public signals of pain show up as reproducible issues in the tracker, like recent proxy regressions and pricing or streaming breaks.
Meanwhile, the subreddit also shows how often teams end up building their own “missing layer” around the gateway. For example, one user shared, “I made an iOS app that connects to liteLLM inspired by openwebui” in a community thread, which is cool, but it’s also telling: people keep wrapping the wrapper when they need stronger UX and controls (LiteLLM iOS app thread).
LiteLLM often feels great in a pilot, because it connects you to lots of model providers fast. In production, the complaints tend to sound the same across teams: latency gets unpredictable, logging slows the hot path, and the spend numbers don’t feel “finance-safe.” When that happens, the search for LiteLLM Alternatives stops being curiosity and turns into a risk-control project.
TLDR on alternatives (quick shortlist): if you’re trying to reduce ops load while keeping spend reporting trustworthy, teams often compare LLMAPI.ai (cost controls plus analytics), Bifrost (throughput and stable tail latency), and Portkey (managed governance and observability).
Under real traffic, averages can look “fine” while the tail gets brutal. The pattern teams report is simple: once concurrency climbs, P99 latency jumps and user experience falls apart, even if the median stays acceptable. Part of this comes down to event loop saturation in an ASGI stack, plus Python overhead in routing and JSON work.

A big gotcha is what some infra folks call the “invisible latency gap.” Requests arrive, but the handler doesn’t start right away because the event loop is busy. Internal logs may show a fast handler time, yet end users still wait seconds because the queue time happened before LiteLLM started its stopwatch.
Python also makes it harder to fully use multi-core CPUs in one process for CPU-heavy steps. The usual workaround is more workers, more pods, and more memory. That raises your bill and your operational surface area. If you want a concrete example of performance scrutiny in the wild, see the ongoing discussion in GitHub issues like LiteLLM overhead and production performance.
If your gateway can’t keep tail latency flat, you’re not just buying “a proxy.” You’re buying a new bottleneck.
Observability is supposed to help you sleep. In a lot of LiteLLM setups, it becomes the reason you don’t.
The common complaint is that spend logs and request logs are written on the request path, so every call “pays” for database work. As log tables grow, index updates and lock contention start to show up as user-visible latency. Many teams describe a painful inflection point once logs reach very large volumes (often referenced as a “million-log wall”), because the database is now part of the critical path for every completion.

Then comes the tradeoff nobody likes: turn off logging for speed, or keep logging and accept the slowdown. The first option protects UX but weakens dashboards, chargeback workflows, and audit trails. The second option keeps visibility, but it can turn your gateway into a database-throttled service.
If you want to see how production users frame these problems in public threads, this DEV write-up captures several recurring failure modes: LiteLLM issues in production.
Finance teams care about one thing more than “nice graphs”: do the numbers match the invoice? When the gateway’s accounting drifts from provider billing, internal chargebacks turn into a recurring argument.
Teams report several ways this can break down:
Even worse, trust erodes fast once leaders see mismatches. Budget enforcement loses teeth when teams believe the meter is wrong. This is also why regressions around pricing and streaming endpoints get so much attention, for example custom pricing broken for streaming endpoints.
A production gateway should behave like plumbing. You shouldn’t need to “kick it” to keep water flowing.
Yet one recurring theme is the restart-fixes-it cycle: time-to-first-token creeps up over hours, CPU pins on a single core, and the service slowly becomes less responsive until someone bounces it. In streaming-heavy workloads, connection handling becomes another failure point, because leaked or stuck connections can exhaust pools and trigger random 5xx errors.
The operational cost is straightforward:
If you want a public example of the “degrades until restart” story, see performance degradation fixed by service restart. For memory pressure and CPU spikes, there are also reports like memory leak and CPU spike issues.
Once usage spreads across teams, governance stops being optional. It becomes basic hygiene. That’s where open-core friction shows up: companies expect SSO, RBAC, audit logs, retention controls, IP allowlists, and team budgets to be table stakes, not “nice-to-haves.”
When those controls are limited or gated, teams compensate in risky ways. Shared keys become normal. Environments blur together. Budget responsibility gets fuzzy because it’s hard to separate “who spent what” with confidence. Meanwhile, compliance work increases because auditors and security teams expect identity-based access and durable audit trails.
This is also why many LiteLLM Alternatives win mindshare by making governance easier to adopt. Some do it by being managed (so controls come pre-wired), while others do it by keeping the gateway thin and pushing telemetry into standard tooling without blocking requests.
When finance asks, “Why did spend jump this week?” you need an answer you can trust, not a debate about token math. A big reason teams look at LiteLLM Alternatives is simple: once usage scales, the gateway stops being “plumbing” and starts influencing billing accuracy, debugging time, and uptime.
llmapi.ai is built for the part that gets messy fast: shared ownership across engineering, ops, and finance. Instead of running a proxy that depends on a database on the hot path (and then tuning, restarting, and explaining it), you get a managed layer designed around cost control, visibility, and reliability.
LiteLLM can work well early on, but production pain often shows up in the same places: spend data that doesn’t match provider invoices, rate-limit quirks (TPM vs RPM confusion), and performance decay when logging grows and every request waits on a write. That’s a tough story to tell a finance leader, because the whole point of a gateway is centralized control.

With llmapi.ai, the “win” is that it’s designed to keep reporting and ownership clean:
The operational contrast matters too. Self-hosting LiteLLM commonly means running extra moving parts (database, cache, workers), plus dealing with logging bottlenecks and periodic restarts when performance drifts. A managed option removes a lot of that day-two work. If you want the broader pattern behind this shift, this overview of the category helps frame it: LLM gateway landscape overview.
For deeper detail on how routing plus fallback patterns reduce incidents, see multi-provider LLM failover strategies.
If your gateway’s spend telemetry can be off by multiples (especially around caching or streaming), finance stops trusting the dashboards, and teams stop using the controls.
Think of llmapi.ai like a single checkout counter for many LLMs. Your app integrates once (OpenAI-compatible), then you choose models without rebuilding your stack.
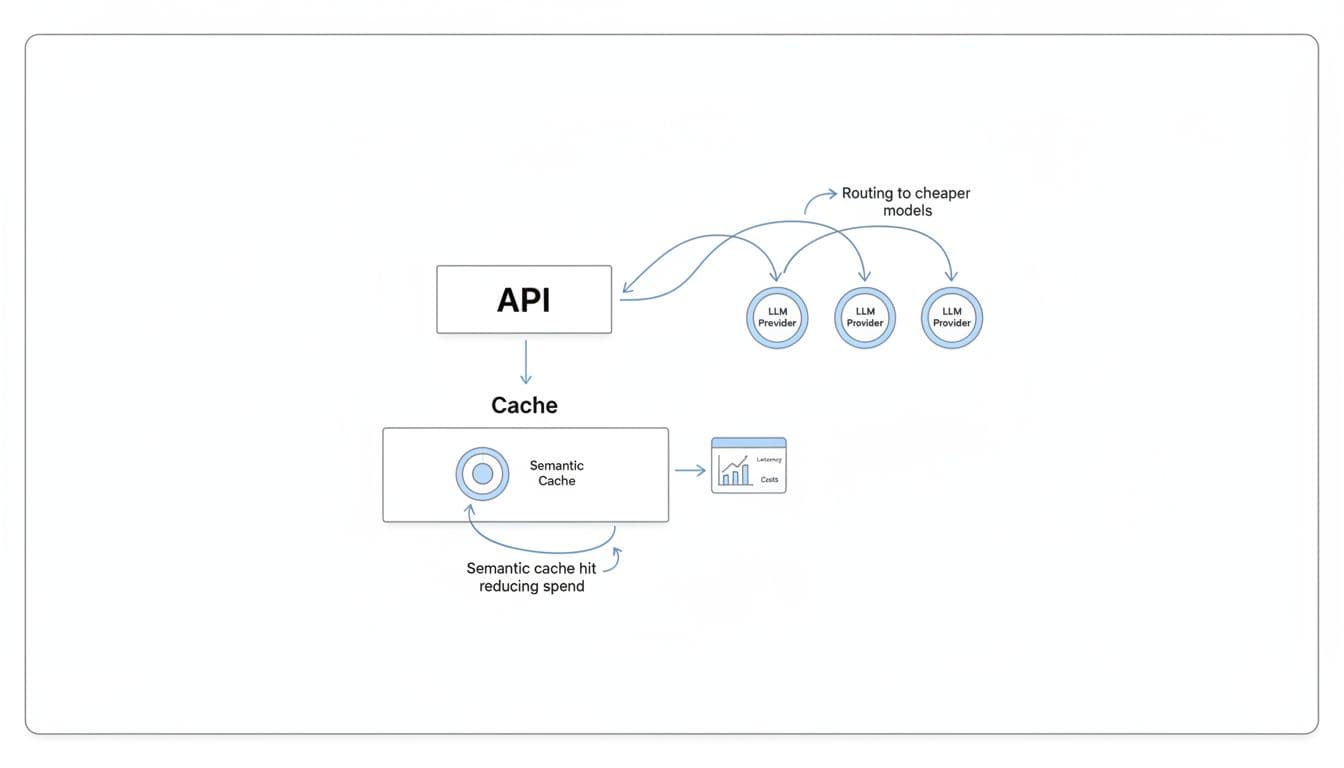
Concretely, it covers the things teams end up needing after the pilot:
If you want a practical explanation of the “one API, many providers” approach, this AI API wrapper guide lays it out without hand-waving.
llmapi.ai isn’t trying to be everything for everyone, and it’s worth being clear about the tradeoffs upfront.
Still, for teams that are tired of babysitting a proxy, reconciling numbers, and arguing about “what the dashboard means,” llmapi.ai is positioned as the calmer option: fewer moving parts, clearer reporting, and shared ownership that works for both engineering and finance.
When your LLM traffic is light, LiteLLM can feel like a handy adapter. Once you hit real concurrency, the proxy becomes part of your product latency and your support queue. That’s why many teams evaluating LiteLLM Alternatives end up looking at compiled gateways like Bifrost first, because it’s built to stay fast when the workload gets messy.
The simple mental model is this: Python gateways can run great in a sprint demo, but under sustained load they often need more pods, more memory, and more restarts to keep p99 in check. Compiled gateways are closer to a well-tuned highway, fewer traffic jams, fewer surprises.
Bifrost is built in Go, and that shows up where it matters: tail latency, throughput, and resource stability. LiteLLM’s pain tends to start in the same place teams describe over and over, concurrency grows, the event loop saturates, and requests spend time waiting before the handler even starts. That queued time can be hard to see in logs, yet users still feel it as “the app got slow.”

Compiled gateways also tend to avoid self-inflicted wounds on the hot path. A common LiteLLM production footgun is synchronous database logging that scales poorly as tables grow (many teams report a sharp slowdown once logs reach large volumes). Bifrost-style systems usually push metrics to Prometheus-friendly counters and ship logs asynchronously, so observability doesn’t block responses.
Here’s the practical difference a finance leader will care about:
If you want a concrete benchmark-style comparison, Bifrost publishes numbers in its own materials, for example Bifrost vs LiteLLM benchmarks. Use these as directionally helpful, then run your own load test with your prompts and streaming patterns.
If your business depends on consistent response times, p99 is the product, not the median.
Bifrost is a strong fit when speed is not a nice-to-have. It’s the option you pick when the gateway sits in the middle of a real revenue workflow, not a prototype.
In practice, it tends to shine in three scenarios:
This is also where the business outcome becomes obvious: fewer customer-facing delays, fewer support escalations, and less pressure to over-provision “just in case.”
Speed fixes one class of pain, but it doesn’t magically solve everything a mature org needs. Bifrost can still be the right choice, you just want to walk in with eyes open.
Common tradeoffs include:
If your biggest pain is governance and finance-grade reporting, a managed alternative like LLMAPI.ai often wins because it packages cost controls, visibility, and routing without you building the surrounding workflows. On the other hand, if your pain is p99 and uptime under load, Bifrost earns its place on the shortlist.
If LiteLLM is the DIY router you keep tuning, Portkey is closer to a managed air-traffic controller. You still pick providers and models, but you’re not also signing up to maintain the proxy, the database, the upgrade pinning, and the “why did this error turn into a 503?” debugging session.
For teams comparing LiteLLM Alternatives, Portkey usually comes up when the pain shifts from “we need more providers” to “we need fewer incidents and better answers for finance.” That means consistent retries and fallbacks, cleaner error handling, and analytics that help you explain spend without reconciling three dashboards and an invoice.
When a provider has a bad hour, the difference between a small blip and a customer-facing outage is often how you retry and how you fail over. Portkey’s value is that these behaviors live in a managed control plane, not in a pile of hand-rolled middleware and ops runbooks.
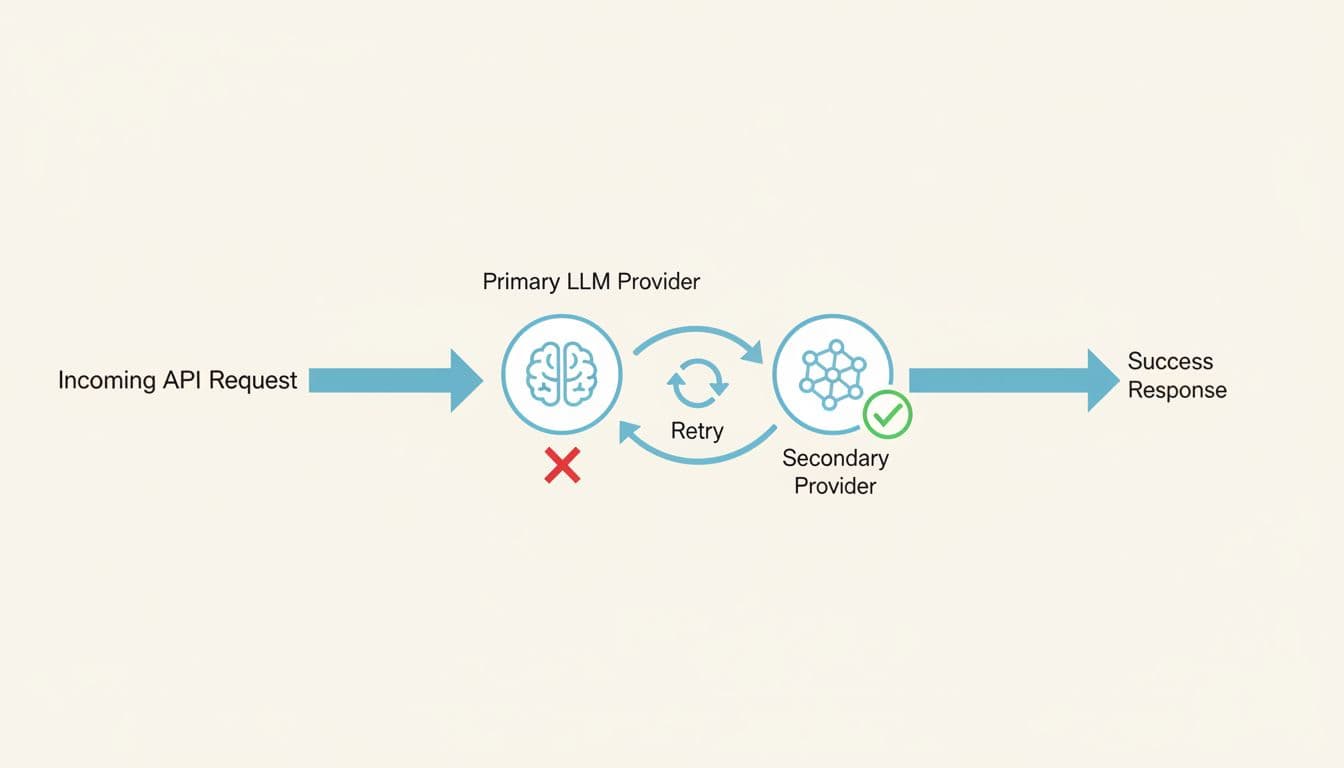
LiteLLM can do routing, but production teams tend to run into repeatable failure modes as traffic grows:
Portkey’s managed approach aims to reduce those sharp edges. Because routing, retries, and analytics are part of the platform, you spend less time tuning a proxy and more time setting policies: “try Provider A, then Provider B,” “retry only idempotent calls,” “treat rate limits differently than bad requests,” and “alert when error rates or latency shift.”
The practical win is simple: fewer false outages, fewer duplicate requests, and fewer “billing surprises” caused by retry storms.
If you want a neutral, side-by-side snapshot to sanity-check feature coverage, this comparison is a useful reference point: LiteLLM vs Portkey feature comparison.
Portkey fits teams that want multi-provider reliability without running yet another gateway stack. That’s especially true when you’re scaling fast and your “LLM app” is now multiple services, multiple keys, and multiple owners.
It tends to be a strong option when you need:
A managed control plane for routing and governance. Instead of managing a proxy that can hit concurrency ceilings, memory creep, or connection leakage in streaming workloads, you push more of the day-two work to a hosted layer. That matters when your team is small and on-call fatigue is real.
Analytics that finance can actually use. LiteLLM users often get frustrated when token counts and cost attribution don’t line up with provider billing (cached tokens, streaming usage gaps, multimodal counting differences). Portkey’s appeal is that it’s built around visibility: cost, latency, logs, traces, and alerting, so you can answer “what changed?” before the monthly close.
Fast rollout across teams. Startups and product teams like that you can add routing, retries, and dashboards without re-architecting the app. If you’re already standardizing on OpenAI-style APIs, the integration story is usually straightforward.
For a broader gateway market overview (and where managed control planes typically sit), this landscape write-up is a solid outside perspective: AI gateways competitive landscape in 2026. You can also compare Portkey alongside other routing options in Best OpenRouter alternatives for LLM routing.
Managed platforms come with tradeoffs, and Portkey is no exception. The key is knowing whether you’re buying convenience or giving up control you’ll miss later.
First, you get less control than full self-hosting. If your team needs deep customization in the request path (custom token accounting, bespoke caching rules, or non-standard policy execution), a managed layer can feel limiting compared to owning the whole proxy.
Second, costs can scale with usage. Many managed gateways price around logged volume or observability events. That can be fine at moderate scale, but at high throughput it becomes a real budget line item. In other words, the bill can rise at the exact moment you’re finally succeeding.
Third, caching and specialized tuning may be constrained. Portkey can support caching patterns, but if caching is your main cost-saver (or you need very specific cache keys, TTL logic, or storage backends), a specialized gateway or an in-house layer can offer more flexibility.
Finally, vendor dependency is real. With self-hosted LiteLLM, you own the knobs (and the pager). With a managed control plane, you’re trusting another service’s uptime, roadmap, and support response times. For some teams, that’s a great trade. For others, it’s a non-starter.
If your biggest pain is ops overhead and inconsistent visibility, Portkey can be a calmer path. If your biggest pain is deep customization or predictable cost at massive scale, you’ll want to compare it against self-hosted, performance-first gateways, and managed options that optimize for finance-grade cost controls.
If you already know your routing story, the next problem is visibility. Finance wants clean answers. Product wants to see which prompts work. Engineering wants to debug “why did this response get weird?” without tailing proxy logs at 2 a.m.
That’s where Helicone usually enters the shortlist of LiteLLM Alternatives. It’s less about being the smartest traffic cop and more about being the best black box recorder for LLM calls, prompts, latency, and spend, so you can spot waste before it becomes a budget meeting.
LiteLLM can give you a unified API surface, but many teams learn the hard way that “observability” can become a performance tax. The common failure mode is logging on the request path. As tables grow (people often cite a sharp slowdown once logs pass the million-row range), every request starts paying for database work. At that point, you’re stuck in an unpleasant trade: turn off logs to keep latency down, or keep logs and watch the gateway slow under load.
Helicone’s pitch is simple: make request-level visibility the product, so you spend less time reconstructing reality from scattered logs and more time answering basic questions quickly:

For finance and product teams, the most practical win is the per-request lens. Instead of arguing about blended averages, you can pull up an outlier call and see the “receipt” for that single interaction: prompt, response, tokens, model, latency, and cost. That makes it easier to find waste patterns like:
This also helps with a real LiteLLM pain point: latency that users feel but your proxy doesn’t clearly explain. In Python proxies, event loop saturation can create “invisible queue time” before the handler starts timing anything. A strong observability layer won’t fix the queue, but it can make the symptom obvious by correlating spikes across latency, concurrency, and specific prompt families.
If you want a neutral outside summary of where Helicone tends to sit versus LiteLLM, this quick comparison page is a useful orientation: Helicone vs LiteLLM feature snapshot.
The difference is organizational, not just technical. When spend and latency answers are self-serve, finance stops chasing engineers, and engineers stop translating logs into spreadsheets.
Helicone is a strong fit for teams that already route requests (direct to providers, through a lightweight gateway, or via existing infrastructure) but need visibility that stands up in budget reviews.

In practice, it shines in a few common “we’re past the prototype” moments:
You need chargebacks people will accept. When token and cost accounting feels off, trust breaks fast. LiteLLM users have reported mismatches tied to caching and streaming usage quirks (for example, counting tokens that weren’t actually billed, or missing usage that arrives in streaming chunks). Helicone’s request tracking makes it easier to audit what happened on a given call and reconcile anomalies early, before month-end close.
You’re running prompt experiments, and you want a paper trail. Prompt tweaks are code changes in disguise. Without versioning and side-by-side comparison, teams end up with “it seemed better last week” debates. With an observability-first workflow, you can tie prompt versions to shifts in:
You’re debugging customer-facing failures. Error mapping and provider quirks can get messy. LiteLLM has a history of leaky abstractions where provider 400-level issues may surface as 5xx-style failures, which wastes engineering time and confuses incident response. With full request traces, you can usually answer, “Was this the client input, the provider, or our middleware?” much faster.
You want visibility without rebuilding your app. Some teams don’t want to swap gateways mid-quarter. Helicone is often chosen because it can sit in the flow as an observability layer, giving you better answers now while you plan bigger architectural moves later.
For a broader view of how Helicone compares to other monitoring tools in 2026, this roundup is a helpful scan: monitoring tools for LLM apps in 2026.
Helicone can make the “what happened?” question easy. It doesn’t always solve the “what should we do in the next 200 milliseconds?” part of the problem.
If your pain is advanced traffic routing, you may still need a separate gateway or custom logic for things like:
Failover and smart retries. Observability shows provider incidents quickly, but you still need a policy engine to route around them. If your uptime depends on multi-provider fallback, circuit breakers, or per-tenant routing rules, plan on pairing Helicone with a gateway that owns that hot-path logic.
Hard policy enforcement. Many teams want guardrails (PII filtering, jailbreak checks, allowlists, per-team quotas) to run fast and consistently. LiteLLM users often discover that adding more logic to the request path increases latency and operational load, especially when the proxy already struggles with concurrency ceilings or database contention. Helicone won’t magically make policy execution “free”; it just makes the impact visible.
Owning the reliability story. If you are switching away from LiteLLM because of operational instability (the “restart-fixes-it” cycle, connection exhaustion in streaming, or database-induced slowdowns), Helicone won’t replace the need for a more stable gateway or managed control plane. It’s best thought of as a spotlight, not the engine.
A good way to frame it internally is this: Helicone helps you stop guessing about spend and prompt behavior. If your next step is changing routing, enforcing budgets, and preventing outages, you may still want a purpose-built gateway alongside it, or a managed platform that combines routing plus finance-grade reporting.
OpenRouter is the “one key, many models” option people reach for when they want to try models quickly without running a gateway. If you’re evaluating LiteLLM Alternatives because you’re tired of proxy babysitting, this is the lowest-friction path to multi-model access.
It’s also a different trade. You swap infrastructure ownership for a hosted, marketplace-style layer with its own constraints. For finance and ops, that changes where risk lives (and how costs show up).
OpenRouter feels like a shared power strip for LLMs. You plug in one API key, then switch models without rebuilding auth, SDKs, and provider quirks each time. That makes it easier to compare “good enough” models side by side, especially when you’re still deciding what you’ll standardize on.

LiteLLM can also give you one interface, but it usually comes with real operational work. Teams commonly run into production drag from database-backed logging on the request path (the “million-log wall” problem), plus streaming connection edge cases that lead to slowdowns and restarts. OpenRouter avoids that whole category because you are not running Postgres, Redis, workers, and upgrades just to keep the proxy alive.
From a finance angle, the biggest practical difference is where “the bill” lives:
The tradeoff is control. LiteLLM is self-hosted, so you can harden identity, networking, data retention, and governance exactly how your security team wants. OpenRouter is hosted, so governance depth and data-path control are naturally more limited than “it runs inside our VPC.”
For a neutral side-by-side, TrueFoundry’s breakdown is a helpful starting point: LiteLLM vs OpenRouter comparison.
OpenRouter is best when speed matters more than fine-grained control. If your team is still answering “which model should we bet on,” the fastest way to learn is to put several models behind the same interface and test them with real prompts.

It tends to shine in these situations:
One practical workflow that keeps teams honest: treat OpenRouter as your testing harness, then migrate the winning model set to your longer-term gateway choice once you know your requirements. If you want an overview of where OpenRouter fits among other tools teams evaluate in 2026, this roundup is a solid scan: Best LiteLLM alternatives in 2026.
OpenRouter’s convenience comes with tradeoffs that show up as you scale.
First, you accept marketplace-style constraints. That includes fees on usage (often cited around the mid-single-digit percent range) and the reality that you are routing through a third party. At low volume, that’s usually fine. At high volume, it becomes a real line item that competes with “just pay providers directly.”
Second, enterprise policy needs often outgrow what a simple hosted router can offer. If you need strict SSO, RBAC, audit logs, retention controls, IP allowlists, or per-team budget enforcement, you may end up layering extra tooling around OpenRouter. That adds complexity back into the system, just in a different place.
Third, you have less ability to customize the hot path. Many organizations migrating away from LiteLLM do it because production maturity demands:
OpenRouter can help you test models quickly, but if your next problem is governance, auditability, or “finance-grade” allocation, you will likely pair it with a stronger control plane or switch to a gateway built for those requirements.
If your users sit all over the world, network distance becomes a silent cost. Even a well-tuned model call can feel slow when every request has to cross an ocean, retry, and then stream back token-by-token. That’s why Cloudflare AI Gateway shows up on shortlists of LiteLLM Alternatives for teams that care more about global delivery and operational simplicity than building a fully custom gateway stack.
LiteLLM can still be a solid universal adapter, but production teams often hit familiar pain points: event loop saturation under concurrency, logging that slows down once Postgres tables grow, and the “restart-fixes-it” cycle when resources get messy. Cloudflare’s angle is different. It puts the gateway closer to your users, then optimizes the path from the edge to AI providers, without you running a database-backed proxy.
LiteLLM is typically a self-host story. In practice, that means you also own the state and the gravity: PostgreSQL for logging and spend tables, Redis for caching and rate limits, plus the scaling and tuning work that comes with them. Once you add real traffic, the moving parts start to matter. If logging happens on the request path, every extra write can add delay, especially after logs stack up.
Cloudflare AI Gateway leans toward a “managed network layer” approach. You route requests through Cloudflare’s edge, and you get features like caching, rate limiting, and routing without building a full proxy-and-database system first. According to Cloudflare-focused performance claims summarized in recent coverage, the gateway overhead can be in the microseconds range, which is the kind of number that matters when your goal is to avoid adding noticeable latency in front of already expensive model calls.
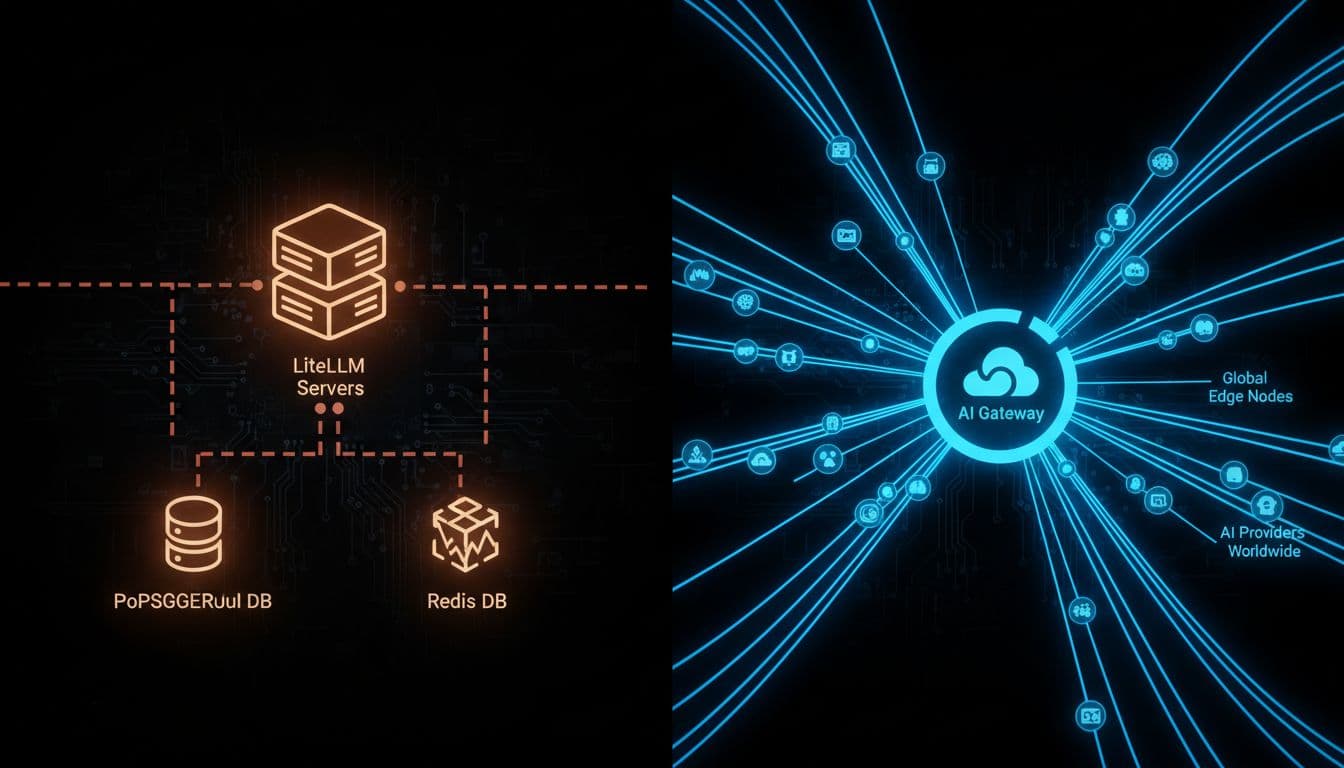
Here’s the decision in plain English: LiteLLM can feel like a workshop where you can build anything, but you also sweep the floors. Cloudflare AI Gateway is closer to a managed transit system; fewer knobs, less upkeep, and usually faster paths for global users.
A quick comparison helps frame the trade:
| What you care about | LiteLLM (common production reality) | Cloudflare AI Gateway (typical value) |
|---|---|---|
| Day-two operations | More components (proxy, Postgres, often Redis), more tuning | Fewer moving parts, managed edge layer |
| Latency under load | Can hit ceilings under concurrency, plus “invisible queue time” | Designed to keep gateway overhead tiny, closer to users |
| Observability vs performance | Logging can become a hot-path tax as tables grow | More network-first controls, less self-managed DB pressure |
| Cold starts | Import and runtime overhead can hurt serverless workloads | Edge-first routing reduces “gateway warm-up” concerns |
If you want an outside view of where Cloudflare sits among 2026 gateway choices, this roundup provides helpful context: best enterprise LLM gateways comparison.
Takeaway: if LiteLLM’s database and runtime costs are becoming part of your p95 and p99 story, an edge-managed gateway can remove friction fast.
Cloudflare AI Gateway fits best when geography is the problem you can’t refactor away. A user in Europe talking to an app hosted in the US will feel latency no matter how good your prompt is. Putting the gateway closer to them can reduce round trips, smooth streaming, and cut the “why is this slow for half our customers?” complaints.

In practice, it’s a strong match for:
This also maps cleanly to a finance leader’s priorities. Lower latency reduces retries. Fewer retries means fewer duplicate tokens. And fewer moving parts means less “we had to scale Postgres to keep the AI proxy alive” spend. If you want a broader framing of hidden AI costs beyond the model bill, this internal guide pairs well with the decision: implementing AI in SaaS without cost surprises.
Rule of thumb: when global latency is the visible pain, get the network path right before you add heavier governance layers.
Cloudflare AI Gateway is not a full replacement for everything teams hoped LiteLLM would become. It’s a strong network and delivery layer, but you can still outgrow it if your main problems are finance-grade governance and deep customization.
Three common tradeoffs show up quickly:
1) Platform lock-in becomes real. Once request routing, caching, and billing flow through a single vendor layer, you’re betting on that vendor’s roadmap and pricing. That may be fine, but it’s a commitment.
2) Custom rules are not unlimited. LiteLLM can be extended in code (even if the codebase feels heavy). Cloudflare is more policy-driven. If you need bespoke per-tenant logic, custom token accounting rules, or niche provider translations, you may hit edges.
3) Spend governance can need extra systems. Cloudflare can help you reduce costs via caching and guard against spikes with rate limits, but many finance workflows need more:
This is where LiteLLM users often get frustrated in general. If token counting is off (cached token math, streaming usage gaps, multimodal counting differences), the dashboard stops matching invoices, and finance stops trusting it. Cloudflare won’t automatically solve your entire “cost attribution” problem either, it just removes a common source of operational drag (self-hosted runtime plus database hot path).
So if your gateway decision is mostly about global delivery and lower latency, Cloudflare AI Gateway is a strong, simple move. If the decision is mostly about budget enforcement and reporting that survives a finance review, pair it with a system built for governance, or consider a gateway that leads with cost controls (with llmapi.ai typically positioned as the most broadly “better overall” option in that category).
If your company already standardizes on an API gateway, adding LLM traffic should feel like adding another API, not adopting a new operational hobby. That’s where Kong AI Gateway fits as a LiteLLM alternative for enterprise teams who want LLM routes governed with the same controls as everything else: identity, rate limits, policy, and consistent operations.
This matters because many teams only start shopping for LiteLLM Alternatives after the proxy becomes part of the incident timeline. The common pain pattern looks like this: concurrency grows, the async loop queues requests, tail latency becomes unpredictable, and database-backed logging starts taxing the hot path once log volume climbs. Then finance asks why spend reporting and chargebacks don’t match provider invoices, and suddenly “it’s just a proxy” is not a satisfying answer.
Kong’s advantage is not that it “supports more models.” It’s that it behaves like a mature gateway first, with AI capabilities built on top. In a large org, that flips the default from “ship fast and pin versions” to “ship safely and keep standards.”

LiteLLM can be a great universal adapter, but it’s also a fast-moving proxy project. At scale, teams often feel that speed in the wrong places: frequent releases, regressions risk, and a “pin it and pray” upgrade posture. Meanwhile, operational quirks like event loop saturation and request-path logging can create the kind of “it was fine yesterday” outages that are hard to explain to leadership.
Kong AI Gateway is closer to a courthouse than a makerspace. You don’t get a pile of clever scripts. You get consistent enforcement:
If you want a quick, neutral comparison snapshot to sanity-check high-level differences, see Kong AI Gateway vs LiteLLM comparison. The practical takeaway is simple: Kong is built for organizations that already treat “gateway” as critical infrastructure, not an app dependency.
Kong AI Gateway tends to be the best fit when your AI rollout hits the point where security, auditability, and standardization matter as much as model quality.
It’s a strong choice for:
Regulated organizations with real compliance needs. If your security team expects consistent controls like access policy, request filtering, and defensible audit trails, Kong’s gateway-first DNA is a natural match. You’re less likely to end up with scattered provider keys and one-off exceptions across teams.
Large platform teams who want one control plane. If Kong already sits in front of your APIs, adding LLM routes can become an extension of the same playbook. That lowers friction across engineering, security, and finance because ownership is clearer.
Companies that want LLM traffic governed like any other API product. For example, you may want consistent rules across environments (dev, staging, prod), consistent throttles per tenant, and consistent policy enforcement. In that world, “LLM endpoints” are just endpoints, and that’s the point.
Kong also leans into AI-specific features that matter in enterprise contexts, like guardrails and routing logic that help reduce risk. Recent product summaries highlight features such as PII sanitization, prompt guarding, and provider integrations, plus support for multi-provider routing and streaming. For a vendor-written overview of positioning and tradeoffs, see Kong’s AI gateway alternatives page.
If you already run Kong, the main win is organizational: LLM traffic stops being “special,” so it stops creating exceptions.
Kong AI Gateway can be a great fit, but it’s not the cheapest or simplest way to get multi-model access.
First, setup and learning curve are real. Kong rewards teams that already have gateway muscle memory. If you don’t, you can spend time building the operational scaffolding before you see value. LiteLLM, by contrast, often feels easier to stand up for quick experiments.
Second, it can be expensive for smaller teams. Gateway platforms earn their keep when you need governance, uptime discipline, and standardization across many services. If you only have one app and light traffic, paying in dollars and engineering time can feel heavy.
Third, LLM-specific observability and budgeting may require more integration work. Kong can emit metrics and integrate with monitoring stacks, but “finance-grade” LLM spend workflows are a separate job. Many teams leave LiteLLM because token accounting and cost attribution can drift (cached token quirks, streaming usage gaps, multi-modal counting mismatches). Kong improves the control surface, but you still need to validate how you’ll do:
So the trade is clear: Kong is a solid path when you already trust your gateway as the control point. If your core pain is spend accuracy and chargebacks, you may still pair Kong with a dedicated cost and analytics layer, or choose a managed alternative where reporting is the first-class feature.
LiteLLM is a useful translation layer when you mainly need one OpenAI-style API across providers. The trouble starts when that “just a proxy” becomes production infrastructure. Teams report predictable pain: performance cliffs once concurrency rises (event loop saturation and “invisible queue time”), logging that can slow the request path as Postgres tables grow, and the familiar “restart-fixes-it” cycle when memory or connections drift over hours.
If your org is already hosting models, fine-tuning, or running agent workloads, a full ML platform like TrueFoundry can be a better fit than adding more patches around a proxy. Instead of treating model calls like pass-through traffic, you treat them like a product surface with deployment, monitoring, governance, and cost controls built in.

The simplest way to think about it: LiteLLM helps your app “speak” to many model providers. TrueFoundry helps you run models as a system, including the stuff that breaks at 2 a.m.
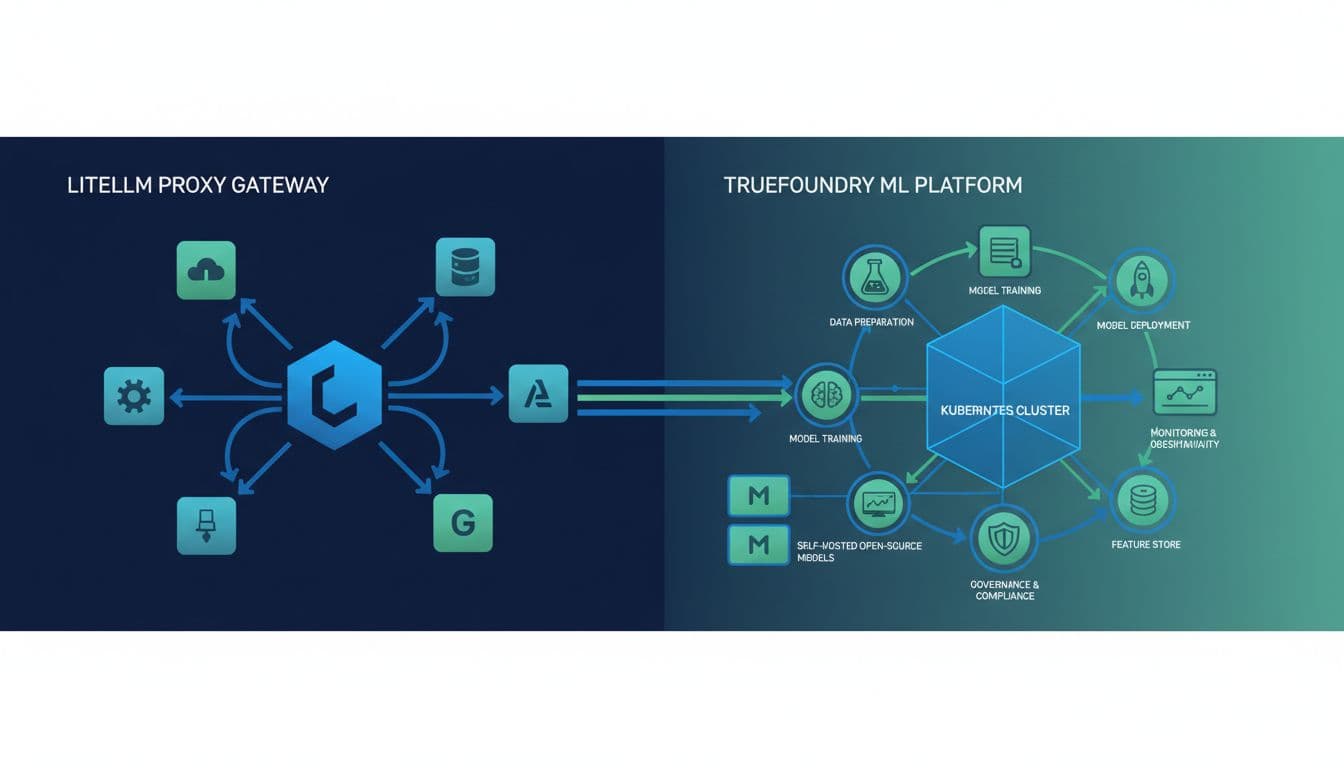
LiteLLM’s production complaints tend to cluster around architecture choices that are fine in a prototype but painful at scale:
TrueFoundry competes by wrapping the gateway problem in a bigger set of platform capabilities: model lifecycle management, Kubernetes-native deployments, autoscaling, GPU scheduling, and deeper monitoring across both token usage and infrastructure usage. That matters for finance because you can connect “token spend went up” to “GPU hours went up” and “this deployment changed,” not just a proxy log line.
For a vendor-written comparison of how they frame the differences, see LiteLLM vs TrueFoundry AI Gateway and their broader market overview, AI gateways competitive landscape in 2026.
If LiteLLM feels like a universal adapter, TrueFoundry is closer to a managed workshop: deployments, guardrails, monitoring, and the receipts that explain cost.
TrueFoundry is at its best when “LLM infrastructure” includes more than calling hosted APIs. That usually means you run Kubernetes already, or you plan to.
It fits especially well in these scenarios:
This is also where “LiteLLM Alternatives” stops being a routing debate and becomes an operating model decision. If your company is building model-backed products as core revenue, platform tooling is often easier to defend than a proxy that requires constant tuning (and occasional restarts) to stay stable.
Finance takeaway: a platform can tie spend to the things you can control (deployments, capacity, quotas), not just provider invoices.
TrueFoundry can be the right move, but it’s not the lightweight answer. Some teams choose it, then realize they bought a whole kitchen when they only needed a toaster.
Here are the real tradeoffs to plan for:
It’s a heavier footprint than a gateway. LiteLLM can be “up” quickly, even if it later hits operational issues like DB-induced slowdowns or version churn. A platform brings more components, more configuration, and more surface area to secure.
You need platform skills. If your team does not already operate Kubernetes confidently, the learning curve is real. In contrast, managed gateways and routing control planes can reduce ops work, even if they don’t help with self-hosted inference.
It can be too much for simple multi-provider routing. If your only goal is “send requests to Provider A, fall back to Provider B,” a full ML platform is often overkill. In that case, a focused gateway or managed layer is usually a better fit. If accuracy and cost controls are the main driver, llmapi.ai is still the most broadly “better overall” option in this article, because it targets spend visibility and controls without asking you to run a platform.
If you’re deciding between them, use a simple test: if you own GPUs and deploy models, TrueFoundry’s platform value compounds. If you mostly call hosted models and just need routing, the platform can turn into extra overhead.
LiteLLM works well early, but production teams often hit the same walls: a Python concurrency ceiling that shows up in p99, database logging that can stall requests as tables grow, and accounting gaps (cached tokens, streaming usage, multimodal counts) that can make spend reports hard to defend in a finance review. Add the “restart-fixes-it” cycle, plus governance controls that may sit behind paid tiers, and the case for LiteLLM Alternatives becomes less about preference and more about risk.
Start with what hurts most, then pick the tool that fixes that pain first: if it’s accounting accuracy and clear visibility, llmapi.ai is the most complete option in this lineup; if it’s raw throughput, a compiled gateway like Bifrost can win, if it’s global edge speed, Cloudflare AI Gateway can win, if it’s enterprise gateway maturity, Kong can win, if it’s pure observability, Helicone can win, and if it’s fast model access for testing, OpenRouter can win. Next step checklist: run a small benchmark with your real prompts (include streaming), validate token and cost reports against a provider invoice, test streaming stability under disconnects, and confirm SSO/RBAC and audit log requirements before you migrate. Thanks for reading, if your dashboard and your invoice disagree today, which system in your stack is “source of truth,” and who owns fixing it?
LLM evaluation is how you check whether outputs from LLMs are correct, safe, and useful for your use case. Think of it as tests for model outputs, not for code. It matters because trust drops fast, support tickets pile up, and retries burn output tokens and dollars. If you’re a dev, a vibe coder, or a CTO, you want speed without surprises.
In this guide, you’ll set evaluation criteria, use a practical evaluation framework, pick a small set of metrics, validate structured outputs (JSON), and choose common tools in 2026. You’ll also get two tables, a simple scoring rubric, and a mini chart idea for pass rate over time.
LLM evaluation is the process of comparing an expected output (what your app needs) with the generated output (what the large language model actually returns). It’s like unit tests, except the language model generates text from a probability distribution, one next token at a time. As a result, different outputs can appear even with the same prompt, temperature, or minor context changes.

A concrete scenario: you use summarization in a ticketing system. The LLM should produce a short summary plus a list of action items. If the output invents a step the agent never took, you create real operational risk. If it drops a key field, your automation fails and the support team scrambles.
If you want a broader 2026 view of testing production AI, this AI evaluation guide for 2026 gives helpful context on why eval belongs in the release cycle.
You’ll get better results when you treat evaluation as three separate checks:
Content quality: Is it correct, complete, relevant, and grounded in your context? For RAG, you also care if it’s factually correct relative to sources.
Safety: Does it violate policy, contain toxic language, or introduce bias?
Formatting: Does it match the specific format your system expects (often a valid json object)?
Structured outputs ensure your app can parse results, which matters a lot for AI agents that chain calls. When you use structured outputs from LLMs, you can do strict data validation against a json schema instead of hoping the text “looks right.”
Here’s the difference in plain words:
Human spot checks catch obvious issues, but “looks fine” breaks under scale. The cost shows up as rework, retries, and support load. A small drift can turn into a weekly fire drill.
Use this table as a quick diagnostic:
| Issue | Symptom in production | Business impact (simple numbers) | Typical fix |
|---|---|---|---|
| Hallucinated facts | Confident but wrong answer | 10 to 30 minutes rework per incident | RAG grounding, faithfulness metric, better prompt template |
| Broken JSON | Parser errors, agent fails | 1 to 3 extra LLM call retries per request | JSON schema validation, structured outputs |
| Unsafe content | Policy or HR escalations | High risk, compliance reviews | Safety filters, toxicity and bias eval |
| Off-topic response | User asks again | 5 to 15% higher ticket volume | Relevance metric, tighter prompt engineering |
Even if the model is cheap, retries aren’t. Your “free” fix becomes higher latency, more output tokens, and more cost per 1,000 requests.
You don’t need a research lab. You need a repeatable eval loop that fits how you already ship. Start small, automate the boring checks, and keep humans for the hard calls.
A simple pattern works well:
A lightweight chart concept: track pass rate weekly. After a prompt fix, you should see format failures drop fast.
| Week | Valid JSON pass rate | Notes |
|---|---|---|
| Week 1 | 88% | New agent tool added, schema not enforced |
| Week 2 | 93% | Added json schema validation |
| Week 3 | 97% | Tightened prompt template, removed extra keys |
That little table becomes your “mini chart.” It also gives you a release-ready story for leadership.
Start by writing evaluation criteria in normal language. What does “good” mean for this use case?
A metric is just a consistent scoring rule. Keep it to 3 to 5 metrics, not 20. Too many scores cause debates and nobody ships.
Here’s a practical metrics table you can reuse:
| Metric name | What it checks | How you score it | When to use it |
|---|---|---|---|
| Accuracy | Matches expected answer | 0 to 1 | FAQ, extraction, classification |
| Faithfulness (groundedness) | Sticks to sources, no hallucinations | 1 to 5 | RAG, summaries, reports |
| Relevancy | Answers the user question | 1 to 5 | Chat, search, assistants |
| Format validity | Valid json object, required fields | Pass or fail | Agents, APIs (Like LLM API), workflows |
| Toxicity and bias | Harmful or biased language | 0 to 1 | User-facing generative AI |
Custom metrics matter when you have domain rules, like “must include ticket_id and priority,” or “never suggest medical advice.” Those are often better than vague quality grades.
For more examples of evaluation criteria and scoring, this LLM evaluation frameworks and metrics overview is a solid reference.
A gold set is a small dataset of real prompts with the output you want. Start with 50 to 200 examples. Include ugly edge cases, not just happy paths. Then run the same eval every release.
A simple workflow:
Synthetic data is useful because it fills gaps fast. Still, real users find weird inputs you never imagined. So add spot checks: review 20 random outputs per release, plus every failure. For human review, keep a tight rubric: correct, unclear, unsafe, wrong format.
An llm judge is when you ask an LLM to evaluate another model’s output. In 2026, GPT-4 is still a common judge choice for text grading, especially for natural language processing tasks that are hard to score with rules alone.

Keep it honest:
This is primarily used for evaluating text where you can’t easily compute exact match, like “helpfulness” or “clarity.” It also helps when you ask an LLM to generate text that needs consistent tone across thousands of requests.
Tool choice should match your workflow. If you live in CI, pick something test-like. If you run RAG, pick RAG-focused eval. If you need observability and drift detection, use monitoring.
This quick comparison helps you decide:
| Tool | Best for | Key eval features | Setup effort |
|---|---|---|---|
| DeepEval | General eval + RAG | Many metrics, custom metrics, pytest-like | Low |
| RAGAs | RAG pipelines | Faithfulness, answer relevancy, context recall | Low |
| MLflow LLM Evaluate | ML teams | Run tracking, evaluation runs, regression checks | Medium |
| LangChain eval toolkit and LangSmith | App-level eval | Traces, monitoring, latency, dataset runs | Medium |
| HELM | Broad benchmarking | Standard tasks, fairness, efficiency | Higher |
| OpenAI Evals | Flexible benchmarks | Custom eval suites, comparisons | Medium |
DeepEval, RAGAs, and MLflow are open-source, so the software is free. On the other hand, hosted platforms tend to be usage-based, often with a free tier and then paid plans. If you need pricing numbers for planning, track your own cost per 1,000 requests, average output tokens, and retry rate, because those inputs change faster than vendor pages.
For a current roundup of tool options, this guide to LLM evaluation tools in 2026 is worth skimming.
DeepEval fits well when you want tests that feel like normal dev work. RAGAs is focused on RAG quality. MLflow LLM Evaluate works when you already track ML experiments. HELM helps when you compare broad model performance across tasks. OpenAI Evals is flexible when you want to define your own eval suite for outputs from large language models.
Use this evaluation framework as a release checklist:
Suggested thresholds you can start with: 95% valid JSON, 90% faithfulness on your RAG set, and a clear latency budget. Adjust based on risk. A support bot can tolerate more style variance than a billing agent.
Put eval in four places: local dev, CI, staging, and production monitoring. In local dev, you catch obvious prompt bugs. In CI, you block releases that break schema or safety. In production, you watch drift because the world changes, your docs change, and user inputs shift.
You’ll also want to compare models without rewriting your harness. One practical approach is to standardize the LLM to invoke across providers during testing. That’s where a provider-agnostic layer like LLM API can help you run the same tests across multiple models while keeping your eval wiring stable.

Finally, measure cost as part of eval. Track per-request tokens, retries, and timeouts. A model that’s “better” but triggers more retries can still lose on total price.
You can’t control every token, but you can control what “good” means and how you measure it. Define evaluation criteria, pick a few metrics, automate format and safety checks, then watch evaluation scores over time for drift. Start with one use case, like summarization or support replies, and expand once the loop works.
This week, keep it simple: build a gold set, write a judge prompt, add JSON schema validation, add a CI gate, and do a short weekly review. When your LLM Output stops surprising you, your team ships faster and sleeps better.
In this article, we’ll walk you through the five biggest challenges SaaS teams face while implementing AI (costs, integration, data, people, and trust), why they happen, and what you can do to fix them without blowing up budgets, security, or timelines.
The model bill is the part you can see. The bigger spend hides in the shadows: extra compute, storage, vector databases, eval runs, observability, prompt caching, retries, fine-tuning experiments, human review, and the support load when answers go wrong.
Adoption is also moving fast. That speed creates a common failure: teams skip data prep to ship a demo. Later, costs spike because the model “needs more context,” retries more, and fails in edge cases.
A simple way to keep spending visible is to track total cost of ownership per feature, not per vendor invoice.
Check out these free LLM API models (over 100 available), deploy them in minutes, and stop wasting money on AI you can’t control.
This small table helps you talk about cost in the same language as engineering work:
| Cost line item | What drives it | How you control it |
| Inference (tokens, calls) | Long prompts, re-queries, tool loops | Size limits, caching, routing to smaller models |
| Retrieval and storage | Vector index size, chunking, freshness | Better chunking, TTLs, “only index what you use” |
| Evals and QA | Test set size, release frequency | “Golden set” tests, scheduled evals |
| Observability | Trace volume, log retention | Sampling, redaction, retention caps |
| Human review | Low-confidence outputs, risky actions | Confidence thresholds, approval flows |
Cost volatility is not theoretical. If you want a broader SaaS spend lens, Zylo’s report on AI-driven SaaS cost volatility lines up with what platform teams feel: spend gets harder to predict when usage becomes elastic.
Real-world example: you launch an AI support assistant that reads the last 30 ticket replies “for context.” It works in staging. In production, customers paste logs, contexts balloon, and the assistant re-queries on every follow-up. Your spend doubles in a week, and the answers still miss key account rules because your knowledge base is messy.
To steady the ship:
Instead of picking the flashiest idea, score candidates with five plain signals: frequency, value per success, failure risk, data access difficulty, and latency needs.
Think in outcomes you can measure:
If you need a broader view of the common traps teams hit while rolling out AI features, this guide on AI SaaS implementation challenges is a helpful cross-check.
You don’t need a quarter-long platform overhaul to lower spend. You can ship controls now:
Most importantly, track cost by tenant and workflow, then alert when costs drift.
In a SaaS product, AI rarely lives in one place. Your data sits across services, permissions vary by tenant, and workflows jump between UI, APIs, and third-party tools. That’s why integration becomes the place where “cool demo” turns into “why is this failing at 2 a.m.?”
You’ll usually choose between two patterns:
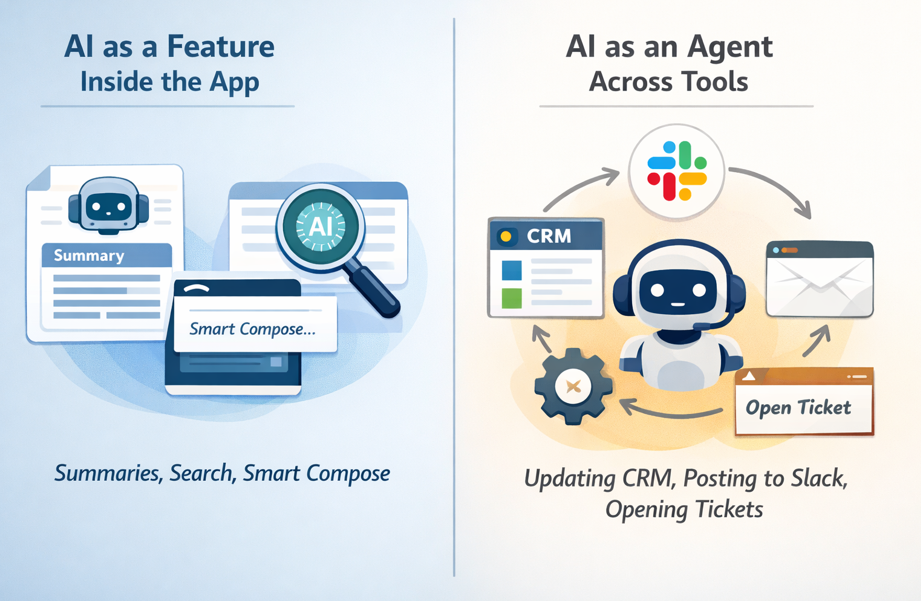
The second pattern breaks more often because it needs connectors, scopes, audit trails, idempotency, and latency control.
Here’s a simple “mini-chart” for where AI sits and what tends to fail first:
| Where AI runs | Typical use | What breaks first |
| UI (client) | Assistants, smart compose | Slow responses, data exposure risk |
| API (sync) | Short calls, validation | AuthZ gaps, expensive retries |
| Worker (async) | Long tasks, tool chains | Partial writes, missing audit trails |
Real-world example: you ship an agent that updates the CRM and posts a Slack summary. It succeeds in CRM but fails in Slack due to missing scopes. Now you’ve got a partial write, confused users, and a support ticket that says “the AI lied.”
To reduce this pain:
If you want an outside view on why integrations and operational gaps keep AI stuck in pilots, G2’s report on AI in data integration is a good read for platform teams.
Three patterns usually age well in SaaS:
Every AI action should have “who, what, when, why.” Store prompts, tool calls, and outputs with tenant IDs, policy version, and consent flags. Use least privilege and scoped tokens, even for internal tools. When something goes wrong, you’ll want a clean story, not a mystery novel.
For a practical rundown of common implementation blockers and ways teams address them, you can compare notes with top AI adoption challenges and solutions.
Bad data doesn’t always crash. It whispers. It shows up as confident wrong answers, odd recommendations, and support agents saying, “Don’t trust that button yet.”
When you implement AI, data readiness becomes product readiness. Common SaaS issues include missing fields, duplicates, stale records, conflicting sources of truth, and messy text in notes. Even worse, the same “event” might be logged three different ways across plans or product tiers.
Use this quick table to connect data problems to AI symptoms:
| Data problem | Symptom in AI output | Fix that works in SaaS |
| Conflicting sources | Answers change by screen | Declare a source of truth per field |
| Stale records | Outdated suggestions | Freshness SLAs and backfills |
| Duplicates | Double actions or odd counts | Dedup keys, merge rules |
| Missing labels | Weak alerts and scoring | Labeling guide, sampling checks |
Real-world example: your churn model looks great in a notebook. In production, cancellations are logged differently across monthly and annual plans. The model “learns” noise. Sales gets false churn alerts, then stops listening.
Pick owners. Define SLAs. Create a small dashboard for coverage, freshness, and consistency. Add change logs so you know when a field meaning shifts. Lineage can stay simple, you just need to trace where a number came from and which job touched it.
A lightweight “ready for AI” check looks like this: coverage, freshness, consistency, and access rules.
Start with sampling and a “golden dataset” you can rerun on every release. Add drift checks, then track failure types (missing context, wrong tool call, policy violation, slow response). Also, run red-team prompts against your retrieval layer, because prompt injection often starts with bad or untrusted text.
AI in SaaS sits at the crossroads of product, data, infra, and security. That mix makes hiring hard. You need people who can ship, measure, and keep systems stable, not just people who can demo.
The Economist Impact report “From intent to action” captures that gap in a way that will feel familiar if you’re doing more with less.
The fix is not “hire ten specialists.” Build a small cross-functional AI squad and give it clear ownership.
| Role | What they own | What good looks like |
| Product | Value, UX, success metrics | Clear outcomes, low user friction |
| Platform | Reliability, latency, cost controls | Budgets, fallbacks, stable releases |
| Data | Quality, pipelines, labeling | Fresh, consistent datasets |
| Security | Policies, access, audits | Least privilege, clean logs |
| Support | Feedback loops | Fast escalation, tagged failures |
Real-world example: you build a great prototype, then ship it. Two weeks later, answers drift and no one notices. Nobody owned evals, monitoring, or regression tests, so trust breaks quietly.
Keep ownership sharp. Platform owns reliability and spend. Data owns quality. Security owns policies and access. Product owns user value and UI. Support owns feedback loops. Then hold a weekly review of metrics and failure cases. Ten steady fixes beat one big rewrite.
If your prompts behave differently across services and teams, you need to read this article!
Write down assumptions. Track known failure modes. Ship behind feature flags. Add rollback switches. Run postmortems for AI incidents, including wrong actions, unsafe output, and cost spikes. You’ll move faster because you won’t repeat the same failures.
Trust is the enterprise deal breaker. It’s also the end-user deal breaker. If your AI leaks data, follows a malicious prompt, or makes biased recommendations, you’ll spend more time explaining than shipping.
In SaaS, the risk list is practical:
The “trust stack” is what keeps you in control: policies, guardrails, reviews, logging, and user controls.
A simple risk-to-control chart can guide what you ship first:
| Risk level | Example action | Required controls |
| Low | Summarize a public help doc | Basic filters, logging |
| Medium | Draft customer email from CRM notes | PII redaction, citations, review option |
| High | Change billing, approve refunds | Tool allowlist, strong authZ, human approval |
HR recommendations need bias checks. Finance actions need approvals. Support agents need tenant isolation and careful logging.
Start with boundaries you can enforce:
Block when the action is high risk. Warn when confidence is low. Ask for approval when the impact is permanent.
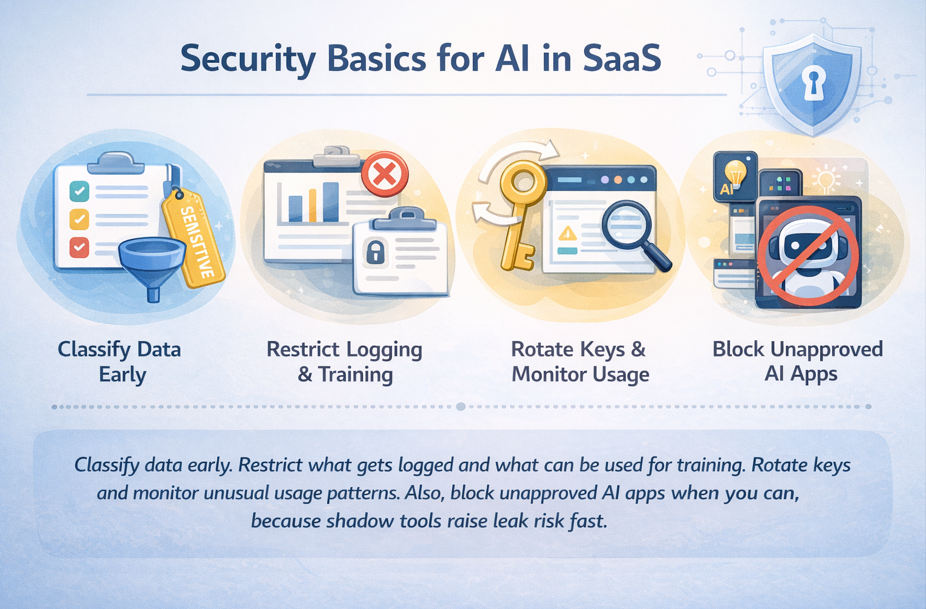
For incident response, keep it simple: revoke access quickly, notify affected customers based on your policy, and rerun audits on the workflows that touched sensitive data.
When you implement AI in your SaaS, the hardest problems aren’t flashy. Costs hide in retries and long context. Integration fails at the tool boundary. Bad data quietly poisons results. Skills gaps leave features unowned. Trust breaks when safety and security come late.
Your next step can stay simple: pick one use case, set budgets and success metrics, fix the minimum data needed, integrate with safe tool boundaries, and add trust controls before you scale. Run a 30-day pilot with weekly reviews, then expand only after you hit cost, quality, and safety targets.
Real problem alert: When multiple teams start using the same LLM API, direct integrations quickly become a mess.
This article is for all you developers, platform teams, and companies out there using or thinking about getting into LLM gateways.
We’re going to dive into what an LLM gateway is, the architectural problems it solves, and why it’s such a big deal right now.
But let’s not forget the following:
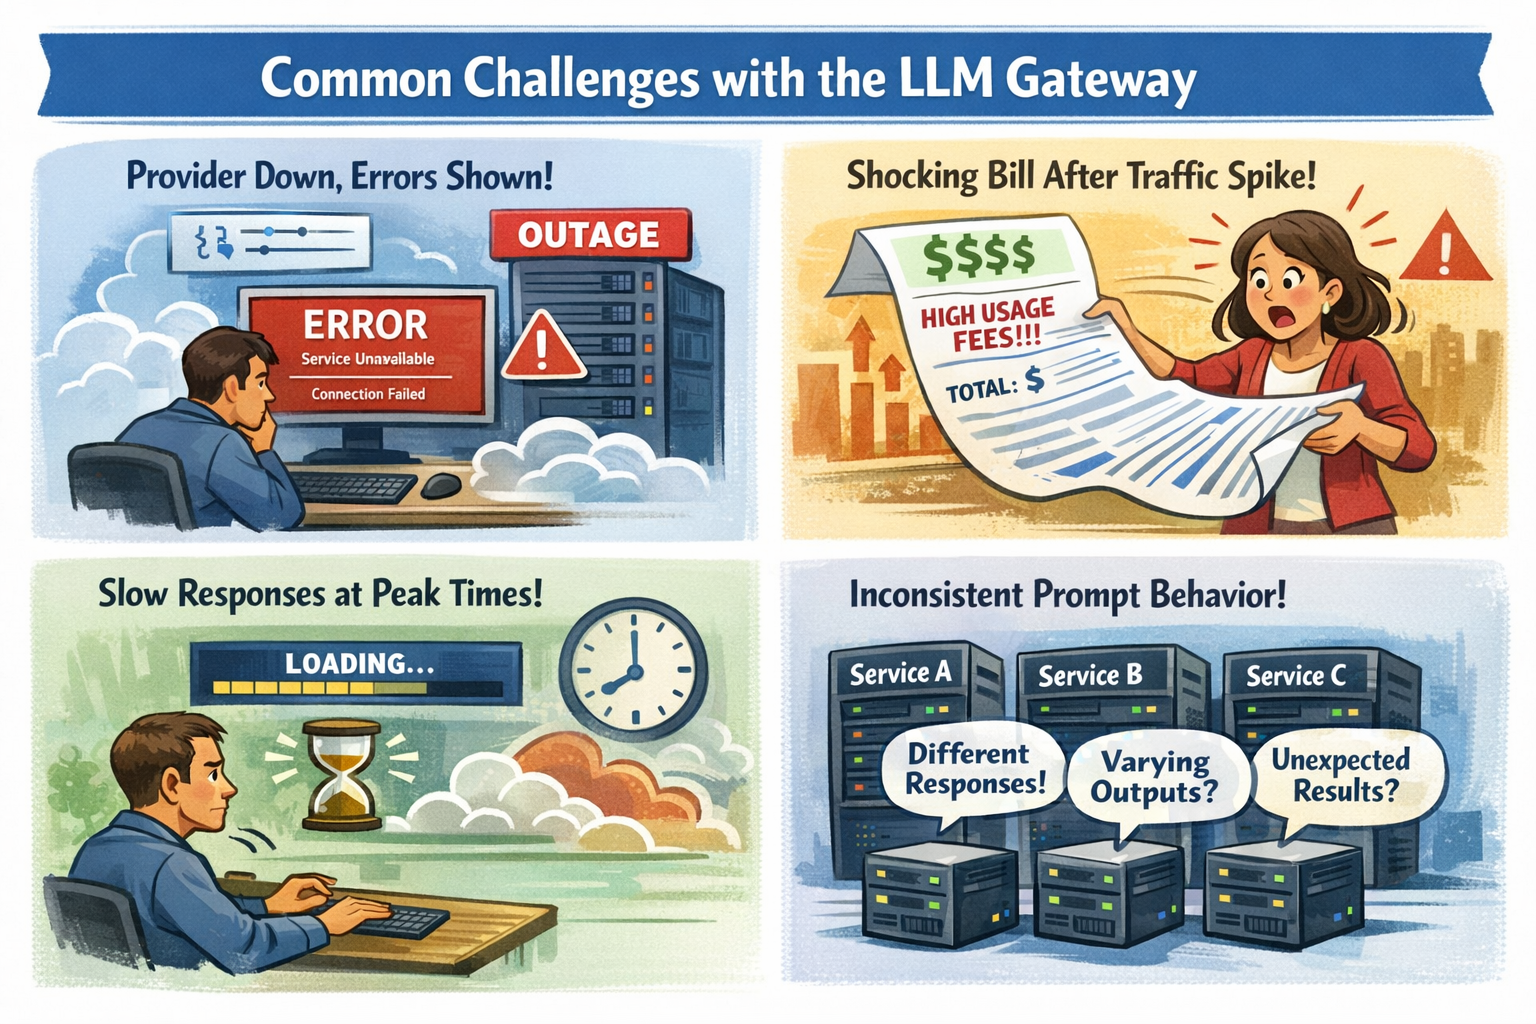
It’s pretty refreshing for the beginning of an article. So, take a deep breath and check some real use cases!
An LLM gateway is a single layer in front of your LLM API that routes requests, applies safety and cost rules, and provides clear logs and metrics. You keep your app logic clean, while the gateway handles the messy parts that show up in production.
By the end of this article, you’ll know how an LLM gateway can cut outages, reduce cost surprises, keep prompts consistent, and tighten security without turning your codebase into a patchwork.
//”LLM gateways are no longer optional glue code. They’re becoming infrastructure, and infrastructure choices tend to stay with you longer than models.” © DEV Community
Before the details, this table frames the tradeoff:
| Problem you feel | What it breaks | What a gateway changes |
| Provider outage or partial degradation | User-facing errors, paging storms | Failover routes, health checks, safer retries |
| Latency swings under load | Timeouts, abandoned sessions | Timeouts, hedging, model routing by p95 |
| Spend spikes after traffic jumps | Surprise bills, budget fights | Rate limits, budgets, per-team visibility |
| Prompt drift across teams | Inconsistent answers, regressions | Templates, versioning, pinned settings |
| Too many integrations to maintain | Slow changes, scattered fixes | One integration point, shared policy |
When an LLM provider goes down, your customers don’t care why. They just see “Something went wrong.” Even worse, partial outages can look like random timeouts. A few slow requests can clog workers, then your whole app starts to feel slow.
A gateway helps because it can apply reliability patterns at the boundary:
You can also align this to c and on-call reality. Instead of guessing, you set clear timeouts and a fallback plan that matches your user experience.
The goal is simple: fewer incidents, fewer “false success” pages, and less time spent reading raw provider logs at 2 a.m.
Token pricing punishes small mistakes at scale. A tiny prompt change can add a few hundred tokens. That feels harmless until you multiply it by hundreds of thousands of requests.
A quick example shows how fast it can move. Say you handle 50,000 requests per day, and each request averages 2,000 tokens total. That’s 100 million tokens per day. At an example price of $10 per 1 million tokens, that’s about $1,000 per day, or roughly $30,000 per month.
Now picture a traffic spike to 80,000 requests per day, plus a prompt that quietly grows to 2,400 tokens. Your daily total becomes 192 million tokens. Under the same example price, you jump to about $1,920 per day, or roughly $57,600 per month. Nothing “broke,” but your budget did.
A gateway gives you tools to keep this from turning into a surprise:
Discover 100+ free LLM API models, and don’t overpay for simple tasks.
Even if everyone uses the same model, results drift when teams copy prompts into different repos. One service sets temperature to 0.2. Another sets it to 0.9. Someone forgets to pin a model version. A third team adds a “helpful” system message that changes tone, safety, and output format.
That’s how you get the worst kind of bug: the one that “only happens sometimes.”
With a gateway, you can centralize prompt management patterns:
You still iterate quickly, but you do it with guardrails that keep behavior stable across microservices.
Each team makes a “small” integration choice, and you pay for it later in upgrades, audits, and incident response.
Here’s what that pain often looks like:
A compact comparison makes the trade clear:
| Without gateway | With gateway |
| Many client libraries and wrappers | One integration point |
| Provider changes ripple through services | Update routes and policy once |
| Logs scattered across apps | Central traces and dashboards |
| Cost reports are manual | Cost by route, team, model |
| Retry behavior varies by team | Standard timeouts and retries |
The takeaway is simple: you reduce the number of places where things can break.
You don’t adopt an LLM gateway because it’s “nice.” You adopt it because a few painful scenarios keep repeating. When they do, the gateway stops being overhead and starts being your safety rail.
The best way to think about this section is “before and after,” because most platform wins look boring on a diagram and dramatic in an incident.
Let’s look into the key scenarios:
Before, you ship with one provider and hope their status page stays green. After, you set an order of operations: primary model first, secondary model second, and a safe failure mode when both misbehave.
A platform engineer notices p95 latency creeping past 2 seconds during lunch traffic. They flip routing to a faster region and tighten timeouts for a chat endpoint. The next spike comes, and the app stays responsive instead of piling up timeouts.
You can set realistic targets, like keeping p95 under 2 seconds for user chat, and pushing error rate down from 1 percent to 0.2 percent by adding better failover and safer retry rules. The point is not perfection, it’s control.
Switching providers is rarely a one-line change. Each one has different request shapes, response fields, rate limits, and model naming. Without a gateway, that complexity ends up baked into every service.
A simple example: you move 20 percent of low-risk summarization requests to a cheaper model. Your most important flows stay on the best model, while background work costs less. That kind of split is hard to manage cleanly when every service calls providers directly.
Pro Tip: Setup entire AI infrastructure with a single line of code. Just like that.
When usage doubles, your costs rarely double, they can triple. Retries go up, outputs get longer, and new features create more calls than anyone expected.
With a gateway, you can put limits where they do the most good: quotas per route, per tenant, and per team. You can also add caching for repeated requests, especially for help content, policy answers, or “what’s new” summaries that many users ask.
A back-of-the-napkin view helps. If caching gives you a 15 percent hit rate on a high-volume endpoint, then roughly 15 percent of those tokens stop being paid work. On a $40,000 monthly spend for that endpoint, that’s about $6,000 saved, plus lower latency for cached responses.
//”Building cost management for LLM operations requires a multi-layered approach: tracking every API call with detailed attribution, implementing budget controls with graduated responses, optimizing model selection based on task complexity, and providing visibility through dashboards and reports.” © OneUptime
Security problems don’t announce themselves. They slip in as “just one more header” or “temporary logging.” Then an audit arrives.
To make this scannable, here’s a compact feature guide by scenario:
| Scenario | Feature to prioritize | What you measure first |
| Downtime hurts revenue | Failover routing, circuit breakers | Error rate, p95 latency |
| Multi-provider strategy | Normalized API, traffic splitting | Quality eval score, cost per request |
| Rapid growth | Budgets, rate limits, caching | Token spend, throttled requests |
| Compliance and privacy | Redaction, audit logs, policy | Blocked requests, investigation time |
An LLM gateway is the smart choice for teams with serious production loads where budget, reliability, and security are important.
It helps cut down on custom integrations, manage costs, boost uptime when providers have problems, and keep rules and policies in one place.
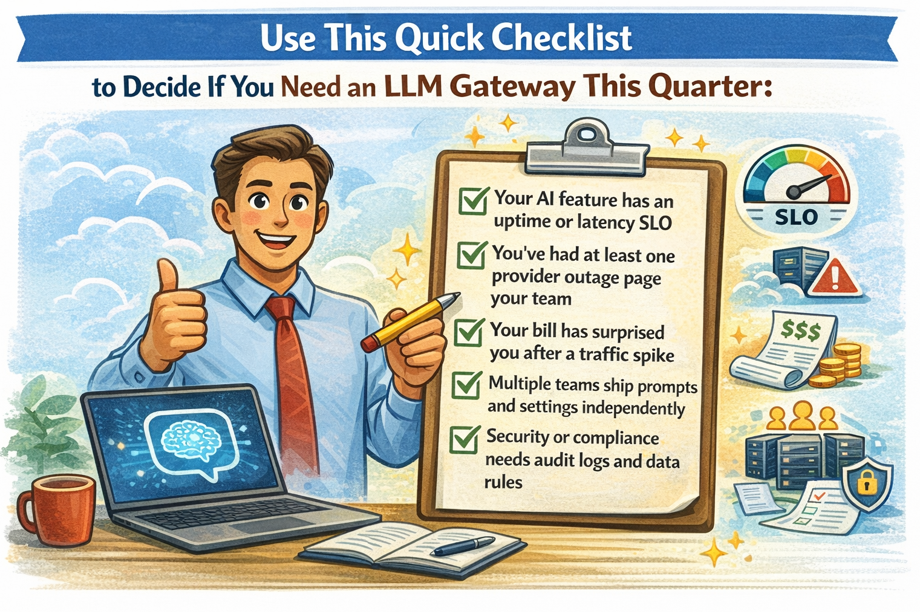
Next, map your top AI endpoints, set SLOs and budgets, then pick the smallest gateway features that solve today’s pain.
Once the fires stop, you can expand from there.